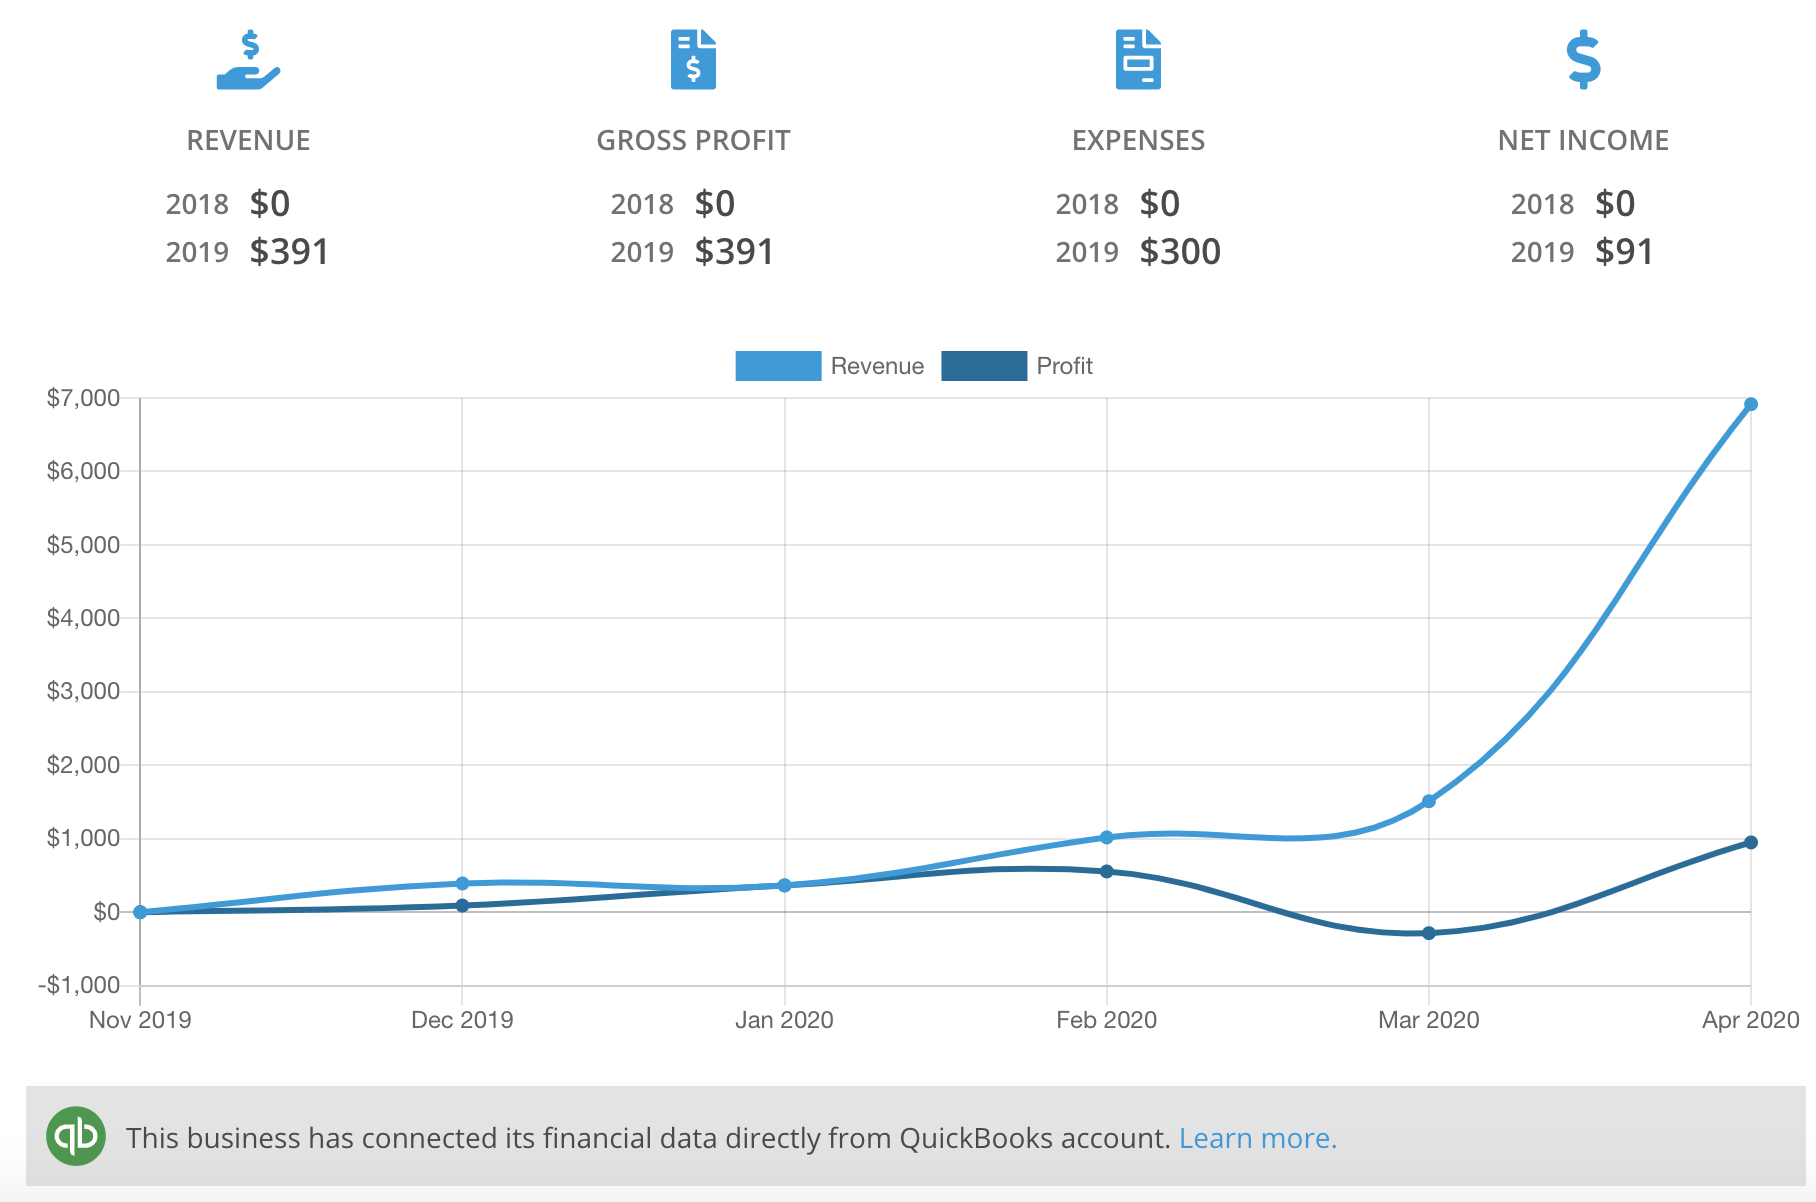
Listings that have shared their financial information using our QuickBooks integration will display an interactive graph. This adds an extra layer of information, providing you, the prospective buyer, with more recent, accurate, and detailed financial information on the business.
The graph will display:
- The business’ monthly revenue for the past 6 months
- The business’ monthly profit for the past 6 months
By hovering your cursor over a given month’s data point, you will be able to see the exact values (revenue & profit) the business put out for that month.


